Work Data visualisation
Data visualisation
How do you show data from the blockchain, without charts or screens full of numbers? That was the question for this pitch. I looked for the answer in an abstract image.
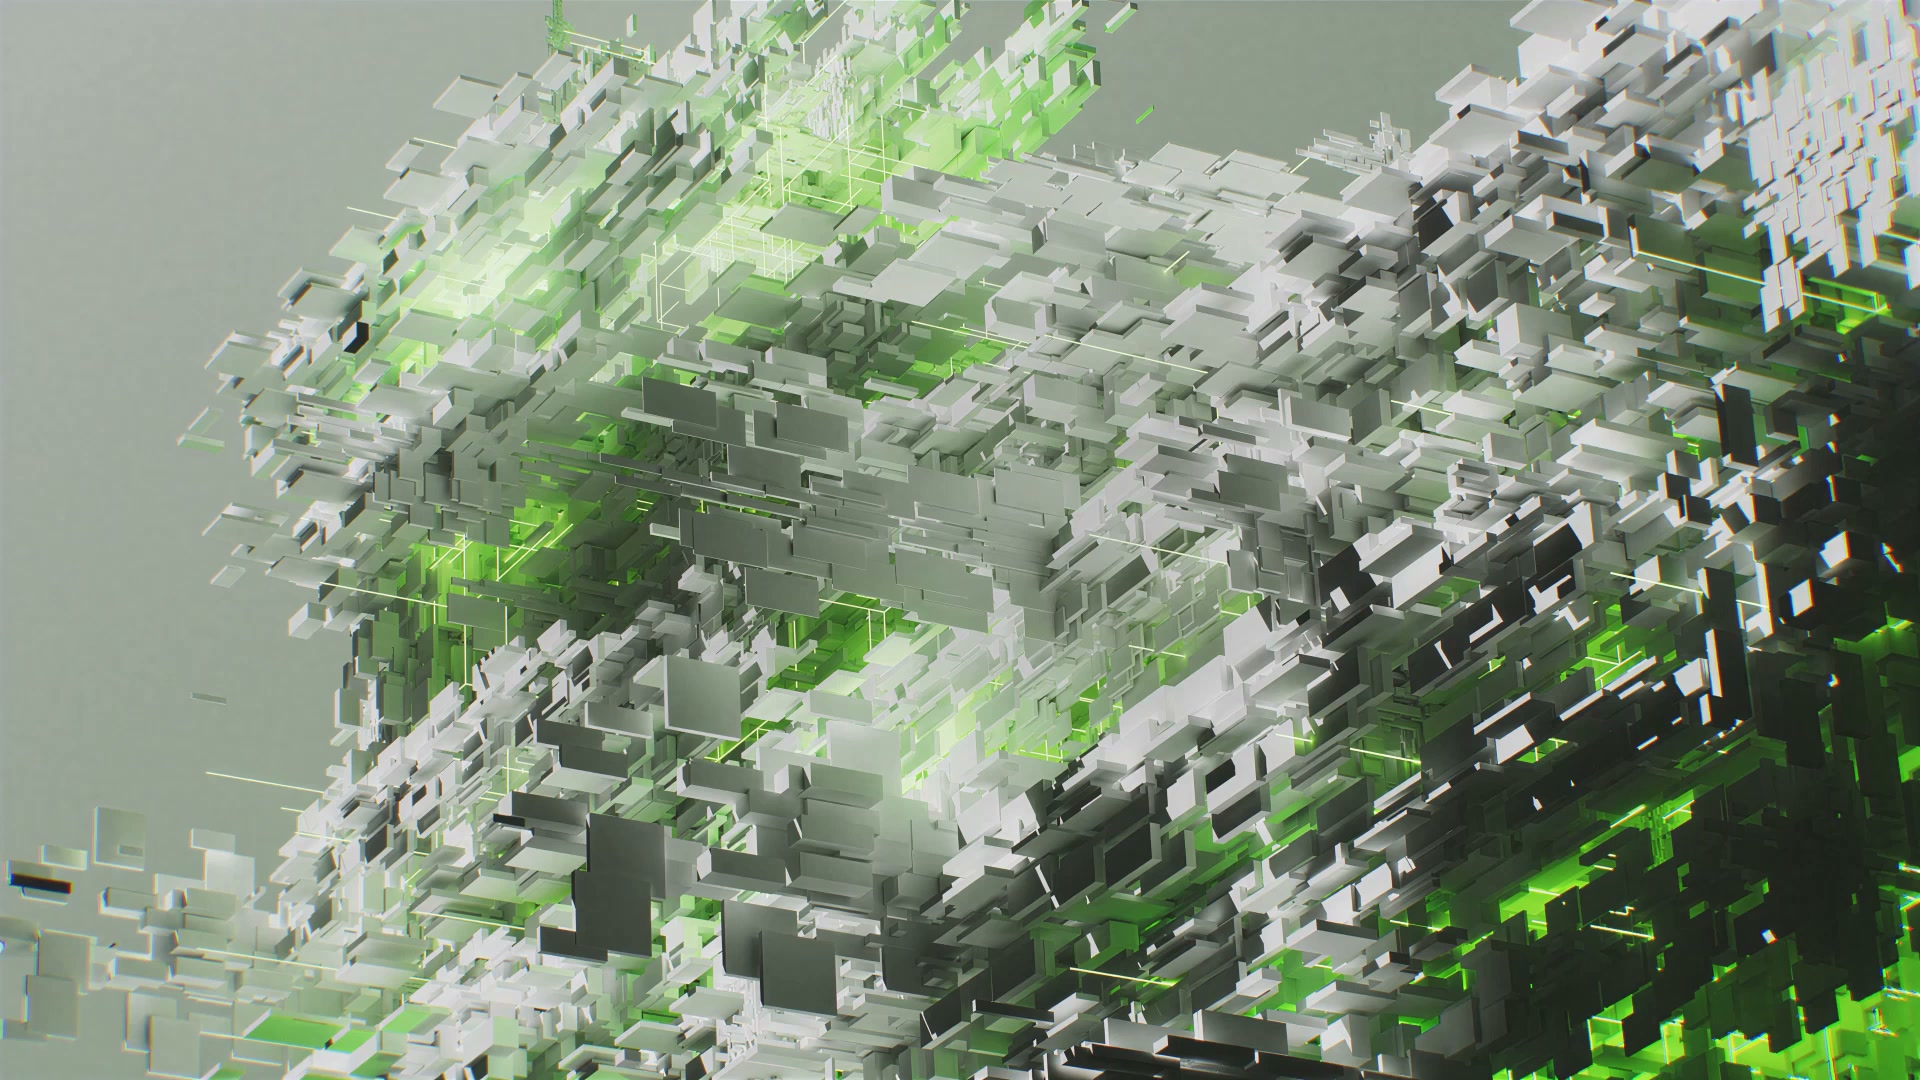
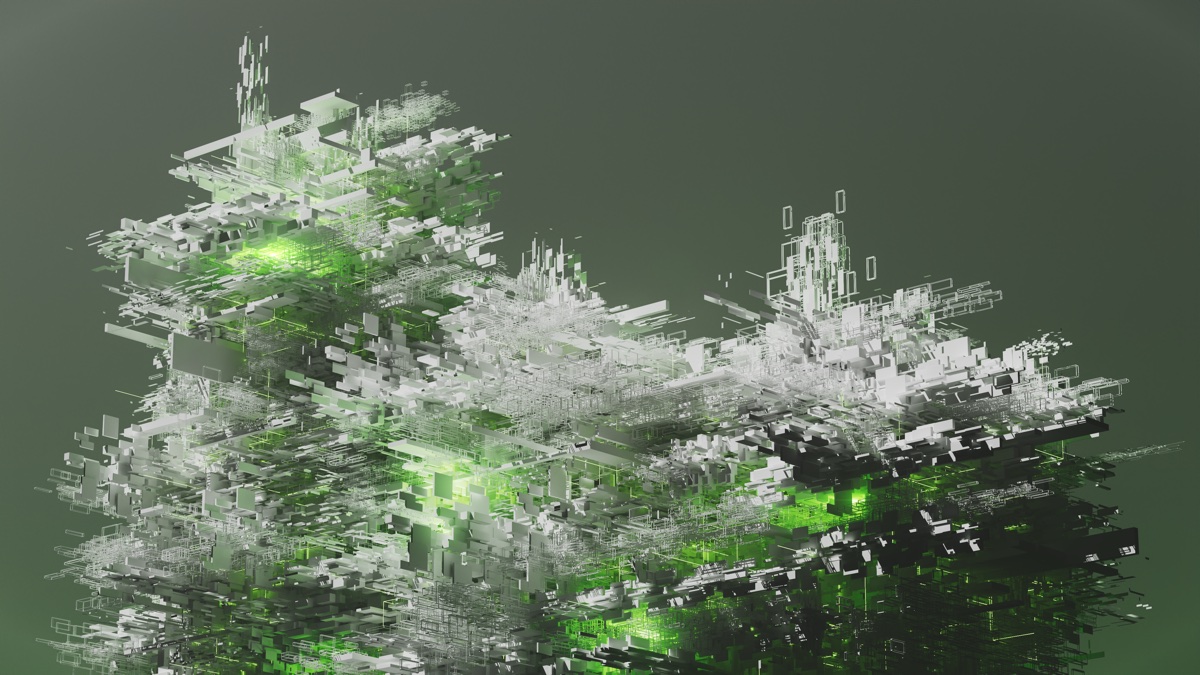
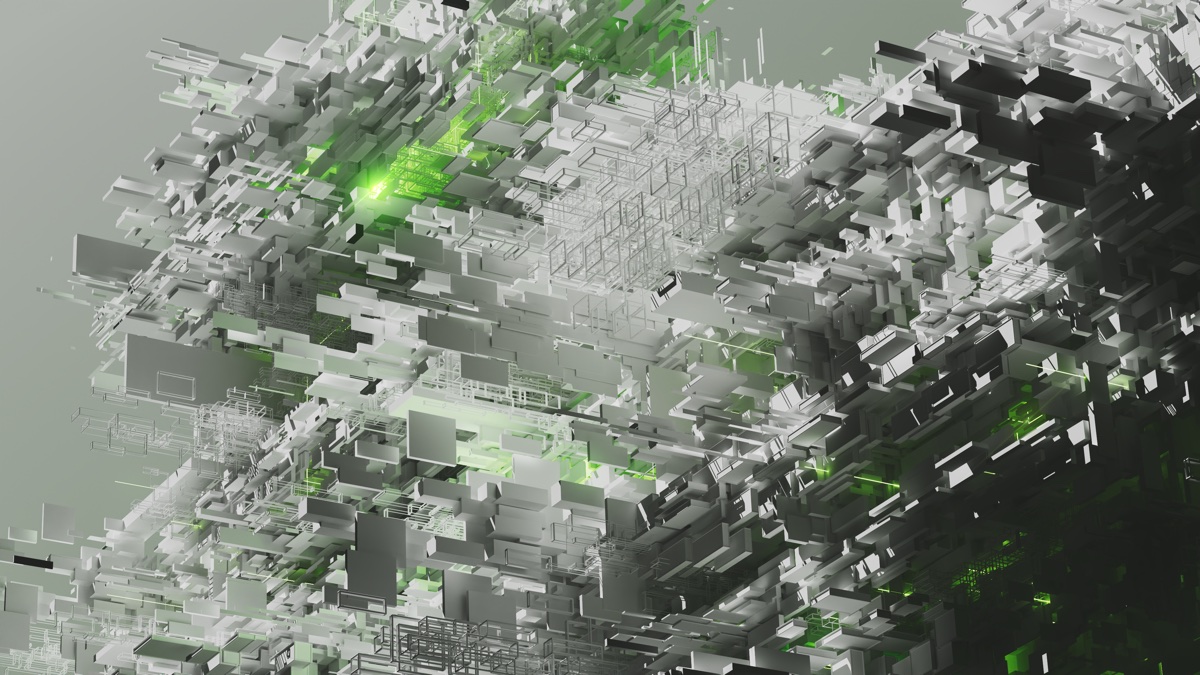
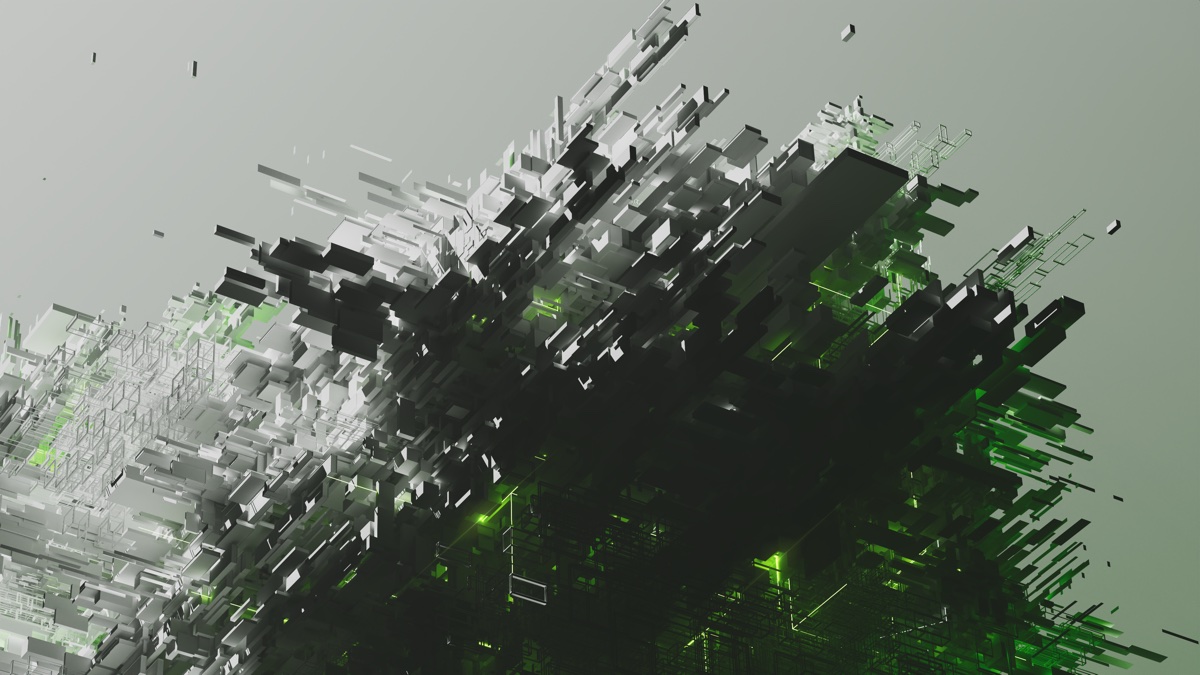
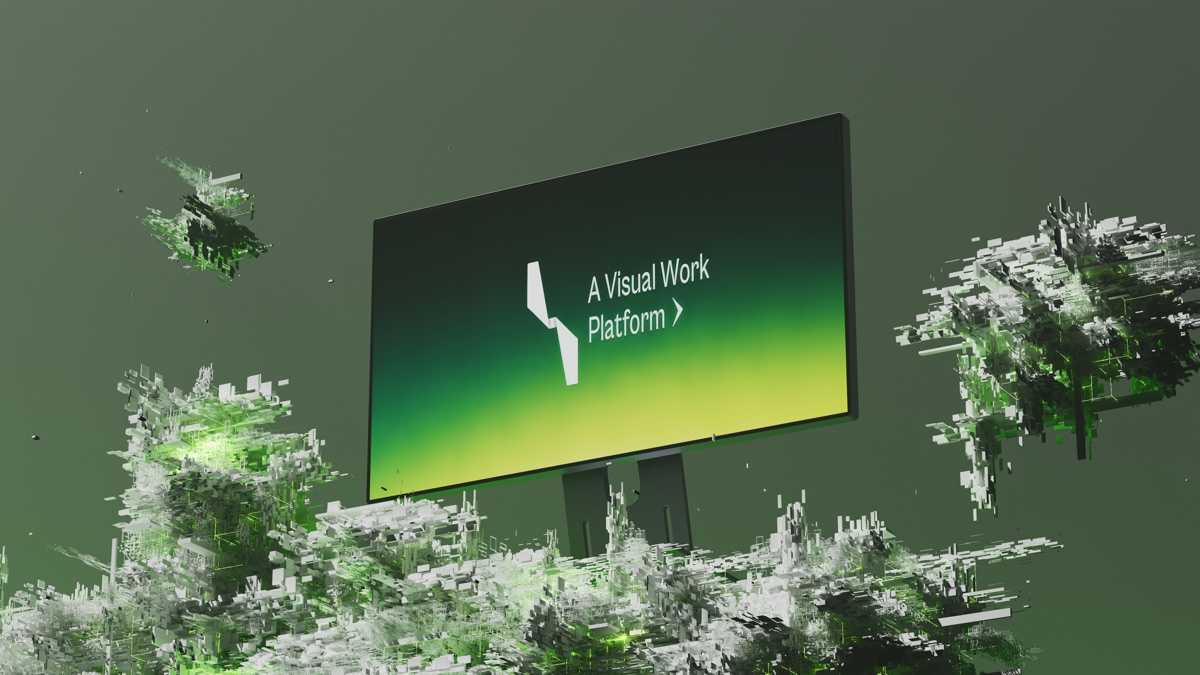
In the styleframes, data becomes a structure of thousands of small blocks and lines that keeps growing. Green light runs through it, like information finding its way. A short animation shows how it works in motion.